There's a 27B vision model sitting on my laptop, and I wanted to know whether it sees anything in a price chart. Not a trading-bot fantasy - a measurement question. Show it 120 one-minute candles with no ticker, no dates, no axis labels, and ask where price goes over the next 15 minutes. Does the answer correlate with anything at all?
The setup: 1,002 chart windows from six crypto pairs, cut from the last 28 days of minute data so the model couldn't have memorized them in training. Each window becomes an anonymous candlestick image. The model is Qwen3.8-27B quantized to 17 GB, running in LM Studio on my MacBook. The whole experiment is 3,256 requests and finished in about two hours.
Read the logits, not the words
My first version asked for JSON with a probability and a confidence score. Useless. Six very different charts came back as 62, 62, 62, 65, 65, 62, confidence 3 every time. Any number a model writes out in words collapses to a few memorized values.
So instead: the model must answer with exactly one word - up, down, or flat - the output is capped at a single token, and I read the probability distribution over that token rather than the token itself. The same six charts stopped being a constant and spread from 43% to 84%. The distribution knows things the words won't tell you.
Two traps on the way. First, offer the model a way out and it always takes it: when "unsure" was one of the allowed words, it soaked up 63 to 94% of the probability mass on every single chart, including charts the model had a strong opinion about one prompt earlier. Refusing to predict is a trained reflex, not an assessment. So the prompt allows no exit, and abstention gets reconstructed later from the shape of the distribution.
Second, this readout silently breaks if the model wasn't actually going to say one of your three words - you end up renormalizing crumbs while the real mass sits on some markdown token. So every request also records how much mass the three answer words cover, with a 0.9 floor. On the strict prompt the floor never fired: 1,002 out of 1,002 passed.
The result is a clean null
Ground truth has three classes: a move smaller than that window's own typical 15-minute move counts as flat. That split the sample into 324 up, 321 down, 357 flat. The primary metric is log-loss against two dumb baselines, thresholds written down before the run.
The model loses to both, and not by luck: the 95% confidence interval on the gap is [+0.55, +0.70], entirely on the wrong side. On charts that did move, ranking by the model's up-vs-down lean gives an AUC of 0.484 - a coin. Plain accuracy is 30.9%, which you beat by answering "flat" every time (35.6%). And its confidence carries nothing: keep only the answers above 0.7 confidence and accuracy is still 31.2%.
But it reads the chart almost perfectly
Here's the control that makes the null interesting. Every chart was also rendered mirrored - flipped upside down, so a rally becomes a selloff. If the model actually reads the image, its up-probability on the original should reappear as the down-probability on the mirror.
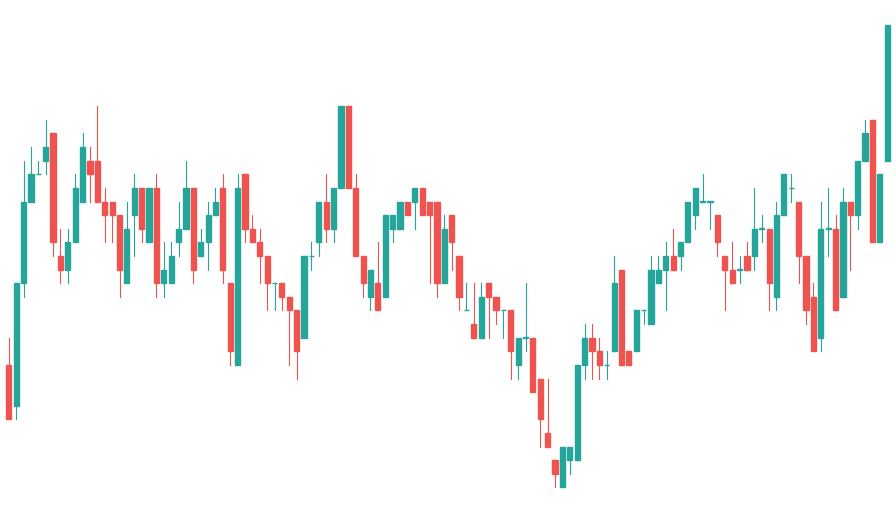
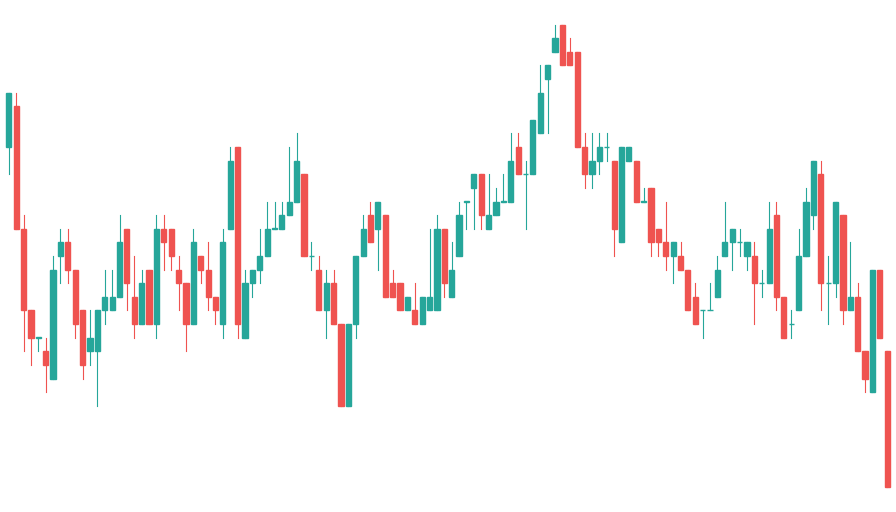
Correlation 0.86 across all 1,002 pairs. So the failure isn't perception - the vision stack does its job fine. There is just no predictive signal in what it extracts. It reads charts like a human chartist, and predicts like one too.
More confident on pure noise
I also slipped in 250 fakes: random walks with no drift, volatility matched to real windows, drawn in the same style. On a random walk the honest answer is a shrug - flat probabilities. Instead, the model's average confidence on the fakes came out slightly higher than on real markets: 0.734 against 0.717.
Whatever generates the conviction, it isn't evidence. The confident-analyst tone is part of the chart-talking reflex, and it fires just as well on noise.
The reflexes run the show
Flat was the most common truth - 357 windows. The model said flat 18 times. Give it "unsure" and it hides in it always; take the exit away and it almost never concedes a chart is going nowhere. Both behaviors come from training, neither comes from the pixels.
A confession about sample size. My first six test charts all came back "up", and I nearly wrote "upward bias" into my notes as a finding. On the full run the model said down 626 times out of 1,002. The bias was in my six charts, not in the model.
Numbers beat pixels, slightly
The same 1,002 windows went in a second time as plain text - 120 closing prices, no image. Same null on direction (AUC 0.476), but log-loss improved from 1.72 to 1.43, because the text version is less sure of itself. The picture adds confidence, not information. That's worth remembering about multimodal models generally.
What I actually measured
A local model can extract the structure of a chart with near-perfect fidelity, narrate it fluently, and know nothing about what happens next - while being unable to tell you it knows nothing, unless you take the "unsure" toy away and read its logits. The gap between reading and knowing is the whole result. I wrote the verdict rules down before running, an old habit from backtesting, and "expected null" was the pre-registered outcome. It still stung for about a minute.
Everything is reproducible from four small Python files: fetch candles, render charts, query LM Studio, analyze. Swapping in another model is a one-line change, and that's the obvious next thing to do.